Parlament
This work was done in the context of the Data Jam Days at EPFL (24-25 Nov 2017).
Intro
The Swiss confederation provides a large amount of data spanning virtually every aspect of the political process in Switzerland. With a convenient API to query the proceedings of committees, councillors, parties, logs of voting sessions …
From this massive resource we decided to study voting patterns in the Swiss government.
Main contribution
Our insight was that voting patterns can be considered as a recommender system : the user-item interaction matrix is a politician-vote interaction matrix.
The attractiveness of this method is that we get some insights “for free”. The matrix completion setting allows for vote prediction : we can guess how likely a politician is to vote yes/no on an issue given his voting record and the voting record of his peers. In the matrix factorisation setting we compute a latent space representation of the politicians and the votes : these factors can represent some higher level characteristics, embedded within the observations. We can compute similarities or correlations in these higher dimensional spaces to get insight on the voting patterns.
Data
Initial research
We first applied our analysis to the subset of the 7 federal councillors. We scraped their complete voting records, and started designing our data exploration pipeline on this set.
Full data exploration
We then scraped the councillors representing 4 major parties of Switzerland * :
- PLR (Parti Libéral Radical) / FDP (The Liberals)
- UDC (Union Démocratique Chrétienne)
- PS (Parti Socialiste)
- Verts
This represents 175 councillors and 1718 voting instances.
A voting instance is considered to be the discussion of an article of law. There are several possible states for each councillor’s voting behaviour on the issue :
YesNoP= President of the concerned committee (can’t vote)EH= AbstainedES= AbsentNT= did not participate
* This is an arbitrary choice, no preferences expressed :)
Results and insights
The main results of the Data Jam Days focus on the representation of voting in the Swiss parliament. They were projected into a 7 dimensional latent space and plotted by reducing down to 2 dimensions with t-SNE.
 Figure 1 : Clusters of voting instances
The voting patterns are overlayed with a party’s voting behaviour. Convention
is to use the color green for a Yes vote and blue for any other voting behaviour.
The party’s line is chosen with a positive bias : if at least one of the members
voted Yes it is considered the party line. This metric will be adapted in a more
refined analysis.
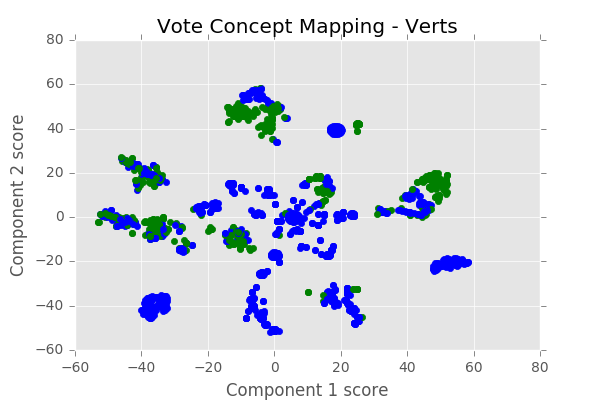 Figure 2 : Clusters of voting instances with voting behaviour (Green party)
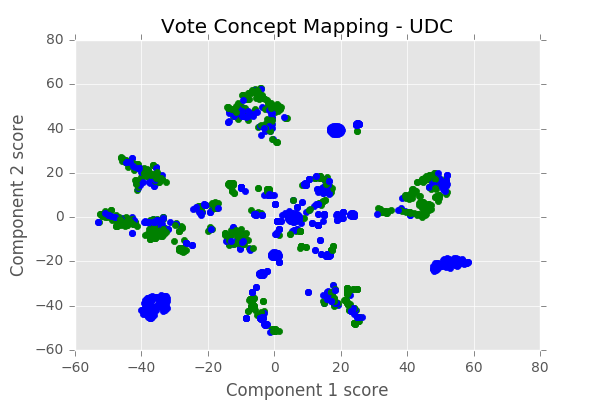 Figure 3 : Clusters of voting instances with voting behaviour (UDC party)
We now highlight conflicting behaviours, colouring in red instances in which a pair of parties has voted oppositely (again, only one conflicting vote is sufficient to tag the vote as such) and in black instances in which parties have voted unanimously.
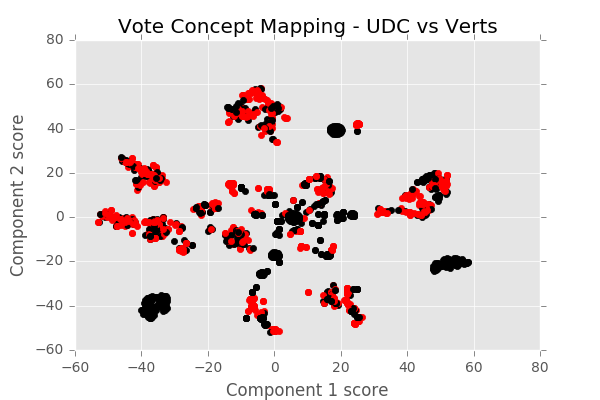 Figure 4 : Clusters of voting instances highlighting conflicting voting patterns (Green vs UDC)
There are many conflicting cases between the Green party and the UDC party, as can be expected from dramatically different political lines.
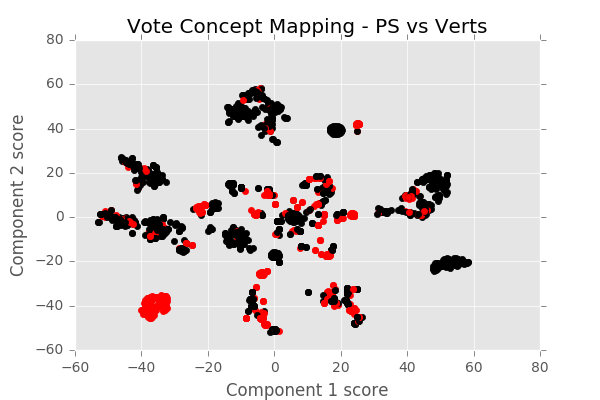 Figure 5 : Clusters of voting instances highlighting conflicting voting patterns (Green vs PS)
PS and Green party are much closer ideologically : they often vote the same thing. Nevertheless we notice a cluster of diverging opinions, which can be identified in a more detailed analysis.
Future work
There are many other projects that can be attempted with this data. Some ideas for exploration include :
- Predicting the voting behaviour of politicians
- Use topic extraction to get insight about the content of the issues
- Which are the most divisive issues ?
- What issues are most representative of a party ?
- What are the most important / the most engaging issues being discussed ?
- Study the temporal evolution of issues, voting patterns, divisions in the political spectrum …
- More fine grained differentiation of the difference in voting pattern
If you feel like attempting these or know of projects that have done this in the past, feel free to contact us !
Resources
* You can read this format from within the notebook
Repository Structure
data: contains the dataset used in this project.img: figures generated to illustrate our work.lib: code utilities used in the project.notebook: IPython Notebook used to run the exploration.
Before running the project, you must install the requirements :
sudo pip install -r requirements.txt
You can then start up a Jupyter Notebook and explore the data in the provided notebooks :
jupyter notebook
License
This work is distributed with a GPLv3 License.
This work was done by
- Dylan Bourgeois (@dtsbourg)
- Lazare Girardin (@lazareGirardin)
- Louis Duvigneau (@loduv)